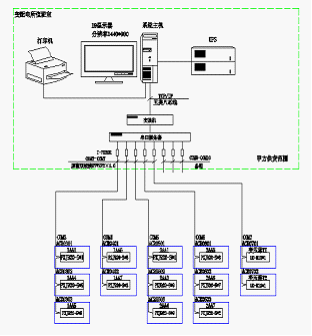
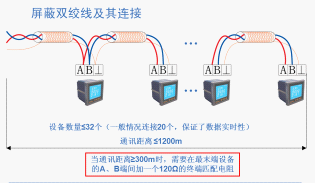
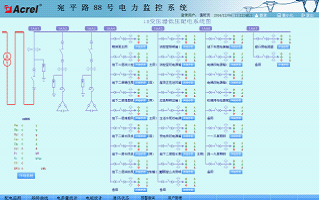
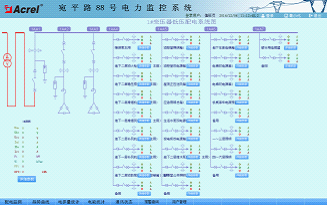
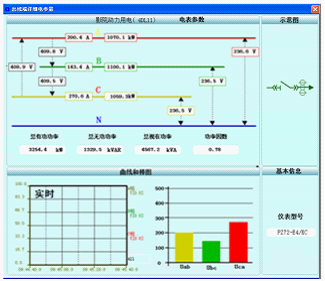
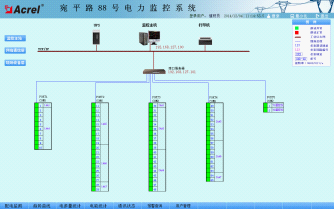
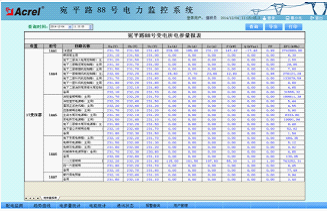
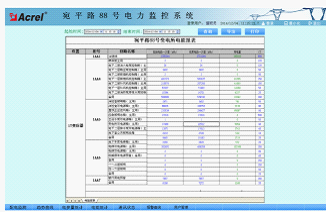
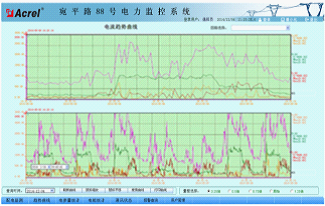
Arkori Qingqing Jiangsu Ankerui Electric Appliance Manufacturing Co., Ltd., Jiangyin , Jiangsu 214405 , China Abstract : This paper introduces the No.88 block of Wanping Road , using smart power meter to collect various electrical parameters of the distribution site. The system adopts the on-site local networking method. After networking, it communicates via the field bus and transmits it to the background. The Acrel-2000 power monitoring and power management system realizes the real-time monitoring and management of power distribution circuit substations . Keywords: Wanping Road No. 88 ; 0.4KV power distribution room; 10KV substation; smart power meter; Acrel-2000/3000; power monitoring system . 0 Overview  Location: No.88 Wanping South Road, Xuhui District Project Use: Commercial Building Land area, building area: construction area of ​​8,047 square meters, 5,413 square meters above ground, 2,634 square meters underground Project Overview : No. 88 Wanping South Road Project is located at the intersection of Wanping South Road and Zhaojiabang Road, Xuhui District, Shanghai. It borders Wanping South Road in the east and Zhaojiabang Road in the north. It echoes with the Xujiahui Greenland and provides services for high-end product display and financial management services. The building, the facade of the building uses a gradual approach to the perfect transition from the classical style stone curtain wall to the modern glass curtain wall style. This project is designed as part of the power monitoring system of the substation. The substation is located on the first floor of the substation. There are two high-voltage inlets, a comprehensive protection device, and a low voltage section. The inlet cabinet and the feeder cabinet are equipped with instruments. The power monitoring system only accesses low-voltage parts. 1 Demand analysis There is a transformer and distribution room at the site that requires centralized data management and analysis. The software probably functions as follows: The monitoring information such as voltage, current, power, power factor and frequency is refreshed in real time and visually and dynamically displayed in a single graph. The electrical parameters of each display loop, loop name, current value and other information on the sub-screen each circuit. A trend curve is drawn for the current of each loop to facilitate analysis of the operating conditions of the circuit power distribution . For electricity meter reading function of each circuit, and can generate electricity reporting period in line with customer management needs. This technical condition applies to the power distribution room at No. 88 Wanping Road . The supplier's products should have high security and reliability, be easy to expand, and be easy to maintain and maintain. The product provided by the supplier shall meet at least the technical conditions, but it is not limited to this. The technical performance of the supplier shall meet the requirements for data monitoring of the power distribution room. 2 system solutions Monitoring system is mainly achieved Wanping passage 88 for electrical power distribution monitoring and power management. Substation monitoring range of T1, T2 of the transformer low voltage line counters, contact cabinet, cabinet feeder meter, a total of five sub-buses, direct access to the bus in this substation acquisition apparatus, thereby realizing the host bus instrument on the monitor Data connectivity with the monitoring host. As shown in the following figure: Station management layer, network communication layer and field device layer. System network topology 1) Station control management Station management The management personnel of the power monitoring system are the direct windows of human-computer interaction. Mainly refers to industrial computers, monitors, UPS, etc. placed in the duty room . 2) Network communication layer Communication layer mainly composed NPORT56 1 0- 8 serial server, Ethernet devices and bus networks. The main function of the NPORT5610-8 serial port server is to monitor the field smart meters; the main function of the Ethernet device and the bus network is to realize data interaction, make the distribution system management centralized, informatized, and intelligent, and greatly improve the safety of the distribution system. Sex, reliability and stability have truly achieved unattended purposes. 3) Field device layer The field device layer is a data acquisition terminal, which is mainly composed of smart meters and comprehensive protection devices . The smart meters are connected to the communication server through a shielded twisted pair RS485 interface using a MODBUS communication protocol bus type bus, and the communication server reaches the monitoring host of the power distribution room. Perform networking and implement remote monitoring . Smart meter on-site connection Field instrument in communication via daisy-shielded twisted pair (RV V SP2 * 1.0), each bus connected to the smart meter number around 20, and then the data uploaded to the server serial NPORT56 1 0- 8, further data Upload to local monitoring terminal. DETAILED connection diagram shown below: The low-voltage line and feeder circuit uses a multi-function meter, which can measure all conventional power parameters such as: three-phase voltage, current, power factor, frequency, active power, and reactive power . 3 system function Features The system adopts an all-Chinese interface, which is simple and convenient to operate; stable and reliable; the system has a system diagram display, simulation diagram display and network structure diagram display; the system provides a friendly human-machine interface, all operations can be carried out on the interface, And it has a remote display function. login interface In order to ensure the safe and stable operation of the system, user rights management functions have been set up. User rights management can prevent unauthorized operations (such as distribution circuit name modification, etc.). Define login names, passwords, and operation rights for users at different levels to provide reliable security for system operation and maintenance. The user level is divided into operatives, engineers, system administrators, these three levels, each level can be assigned individually different operating privileges, including access to running out of operation, remote control, report management. The system administrator is the highest level user. Users at a higher level can add or delete the next level of users. The interface of the monitoring system is divided into three sections, title interface, power distribution system interface and menu switching interface. The title screen shows the current login user and system current time . The current interface corresponds to various parameters displayed in the system interface. The buttons arranged in the menu switching interface are the function switching buttons of the system. Different function buttons can enter the corresponding function interface. Power distribution monitoring Distribution monitoring interface This interface can observe the real-time running status of incoming cabinets and outlet cabinets. Detailed parameter interface In the "Detailed Parameters" window, you can view the distribution and connection of the distribution circuits and the main electrical parameters. The main data includes: three-phase current, three-phase voltage, power of incoming circuit, energy, power factor, loop name, and the current and loop name of the outgoing circuit. When you choose to log in to the system as "Administrator", you can click on the loop name in the system diagram once to directly modify the loop name. After the modification, the system will save it automatically. In the system diagram, the on and off of each circuit will be indicated by switching between red and green, red means the circuit is on, and green means the circuit is off. Communication status The communication status of each device in the access system is displayed in real time, the entire system network structure can be completely displayed, and the network communication status of the system can be diagnosed online. When a network failure occurs, faulty units and fault locations can be automatically displayed on the screen. In this way, the system maintenance personnel can easily grasp the communication status of each device on the site in real time, timely maintain the abnormal equipment, and ensure the stable operation of the system. Communication state diagram Electrical Parameters Report The storage and management functions of real-time power parameters and historical power parameters, all real-time collected data, sequential event records, etc. can be saved to the real-time database. In the monitoring screen, you can customize the parameters to be queried, the time period of the query, or the number of records that were recently updated by the query, and display them by means of reports. This function is convenient for users to conduct accident retrospective inquiries. Electrical parameter report function Set the time required to query , click the query button to query the electrical parameters report of each circuit at a certain moment in history. The main data includes: three-phase voltage, three-phase current, active power, reactive power, power compensation factor, and electric energy. This report contains all the loops. Help users to understand whether the voltage instability, current limit, power, and power factor meet the requirements during system operation at each moment. With this as the basis, the system is better management and optimization. Reports can be exported to a spreadsheet the way, along with the print function. Click Print Report and print the report as needed . Energy report The integrity of the measurement system is reflected in rich data reports. The system has the functions of periodical meter reading and statistics collection. Users can freely inquire about the power usage of each distribution node in any time period since the normal operation of the system, that is, the power consumption of the node's incoming line and the power consumption of each branch circuit. Report. This function makes electricity visible and transparent, and can trace back when the error of power consumption is too large, and maintain the correctness of the measurement system. Energy report function     The management of electricity consumption is presented in the form of a report. The report can present the power consumption of each circuit during any period of time during the operation of the system. Each inlet circuit and its outlet circuit are produced in a table, which facilitates the query. . By adjusting the start time and the end time, the power consumption during this time period can be displayed . The reports can be exported to a spreadsheet the way, along with the print function. Current curve The current curve is designed for the total incoming circuit of the distribution system (or the outgoing line of important loads) . It is convenient for distribution maintenance personnel to grasp the power demand and the power system load share in time, ensure the reliability of power supply, and provide protection for users' rights and interests. With this function, it is also possible to analyze the growth trend of energy demand, timely adjust demand reports, and reduce unnecessary payment due to excessive demand deviation. Current curve function The X-axis of the curve chart represents the time span, and the Y-axis represents the range . Select the corresponding loop refresh curve to display the one-day and seven-day history curve display of the selected loop. The current curve can help users perform power quality analysis and fault analysis. Alarms and events Real-time alarm The real-time alarm window monitors the telemetry collected by the system. The alarm window opens automatically when the system is running and remains hidden in the background. When the current or voltage exceeds the limit and the alarm limit is reached, the corresponding real-time alarm window will automatically pop up and display the specific alarm information in red font: the circuit name, the over-limit electrical parameter, and the alarm value. Historical alarm By adjusting the start time and end time, you can query the system alarm information in any time period in the past, including telemetry alarms and remote alarms, as well as the specific alarm time, alarm type, and alarm content. 4 Conclusion In today's application distribution facilities, the safety-critical power distribution substation, Acrel-2000 power monitoring system described in this article in the application of Wanping Road No. 88, can be achieved on the substation power distribution circuit for use The real-time monitoring of electricity can not only show the power status of the loop, but also has the function of network communication. It can be combined with serial servers and computers to form a power monitoring system. The system analyzes and processes the collected data, displays the running status of each distribution circuit in the substation in real time, and has a pop-up alarm dialog box , voice prompts , and a short message warning light , and generates various energy reports. , Analysis of curves, graphics, etc., to facilitate remote meter reading and analysis of electricity, research , the system is safe, reliable, stable, to provide a real and reliable basis for the factory to solve electricity problems, and achieved a good business efficiency. references: [1]. Cheng cause any week. Electricity measuring digital instruments Principles and Applications Guide [M]. Beijing. China Electric Power Press. 2007.4 [2]. Zhou Zhongzhong . Smart grid customer end power monitoring and power management system product selection and solution [M]. Beijing . Machinery Industry Press . 2011.10
Acrylic File Organizers
Whether we are in office or at home, no one wants files clutter up on our desktop, or it always takes a long time to find the document we really need. This is why we need Acrylic Desktop File Organizer to keep them organized. New Bolly Display carries a large selection of Acrylic File Trays and Acrylic File Holders in different sizes and colors, and many have special features Acrylic File Boxes that allow user to easily access their paperwork. Our Acrylic File Document Organizers will meet your needs for your company or home's organization.
Acrylic Paper Organizer,Acrylic File Document Organizers,Acrylic A4 Paper Filing Organizers,Acrylic Desktop File Organizer New Bolly Display , https://www.newbolly-display.com